Splunking Your VoIP Gaining visibility into VoIP Phone Logs for U.S. Embassies
Splunk Tells Us What’s Going on When We’re Not Home
Why I Splunked My House
My house was one of the first things I started to Splunk with my free time. I have over 100 devices around my home such as open/close sensors, motion sensors, alarms, presence sensors, light bulbs, speakers, wall switches, outlet switches, a thermostat, and more. All of the devices report to a SmartThings hub in my house. Through this hub and its companion app, I setup alerts like notifying me if there’s any motion happening when no one is home. Also, I automated routine activities, like turning the lights on when someone walks into a room.
When I started pushing all these events from my SmartThings hub into Splunk, it was as an experiment. I wasn’t sure what I hoped to get out of it, it was just something fun for me to try. By adding Splunk into the equation and sending these event occurrences (door opened, light turned on, motion happened, etc.) to Splunk, I realized I could analyze a timeline of events much, much easier.
Here are a few things I could get out of Splunking my house!
SECURITY
What if someone were to break in while no one was home? Splunk gives me one point of login to see all the events that happen, so if someone were to break in, I would be able to easily see exactly what their path was, what rooms they were in, what doors they opened, what lights they turned on, and much more. Another key attribute that Splunk gives me when looking at a timeline of events is the exact timestamps for each of the events. This means I’d be able to tell how long they spent in a particular space.
OPERATIONS
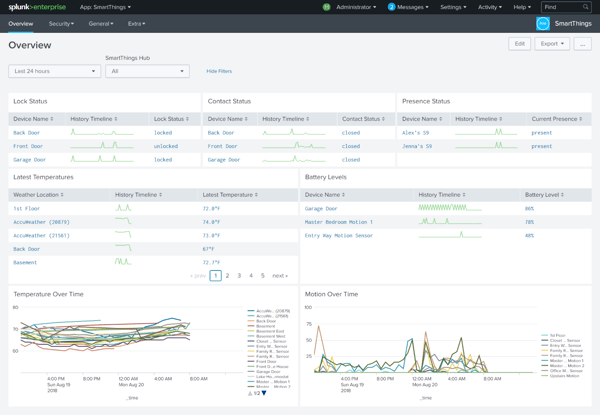
All the motion sensors and door sensors around my house have temperature sensors in them and they report the temperature to the hub. In Splunk, I built a simple visualization showing the temperature throughout my house over time, in a line chart with different lines for each temperature sensor.
Then, I added an integration with AccuWeather so that I could correlate the temperature outside of my house to the inside temperature. I wasn’t sure if this visualization would give me any good information or if it was just a funny use case for Splunk to see the weather go up and down throughout the day. I logged into Splunk the next day to check out the dashboard I made and I was shocked at what I learned. The temperature near my back door inside my house went down in almost a parallel line with the temperature outside, while the temperature throughout the rest of the house remained the same. This meant that I was losing a lot of heat around the back door. I learned that the insulation around this door needed to be replaced.
WHY SPLUNK?
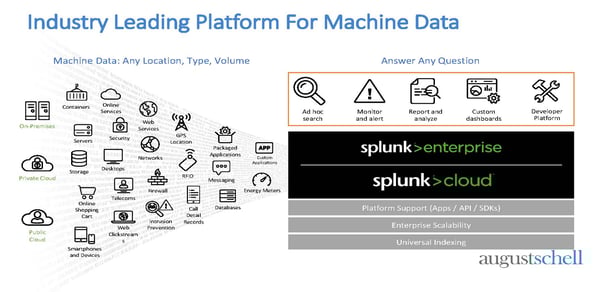
With Splunk - unlike traditional data analysis tools - you don’t need to understand the data upfront. Splunk indexes data and extracts fields during search time, or what Splunk calls Schema on the Fly. There is no relational database under the hood to shove data into. This means that there is no need to pick and choose which fields you keep and which fields you toss. There is no need to filter your data, which means it is all there to search, since you don’t know all the questions you are going to ask of your data when you on-board it. This is a classic example of Splunk that I see all the time with customers and is also a key differentiator that shows why Splunk is truly the market leader of big data analysis.
The dashboard built showing the temperatures throughout my house is only one example of how Splunk can be used to visualize these events coming from my SmartThings hub. I’ve also built dashboards to also account for other security events such as motion detection, arriving/leaving presence, open/close events (windows, doors, cabinets, etc…), and security alarm triggers and other general events such as battery levels on devices.
I have wrapped up all these dashboards into an app called the Splunk App for SmartThings. It is not available yet on the Splunk App store, but I have plans to share it there shortly.
A Look into the Splunk App
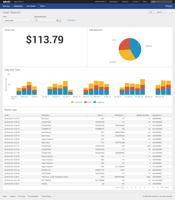
When click into the app, you will be taken to the overview page. This dashboard is designed to give you a 50,000 ft. view of what is going on in your house in real-time. This dashboard shows you the latest context statuses from alarms, locks, contacts statuses, presence status, latest temperatures, and battery levels along with a sparkline for each device so you can easily see the count of status changes over time. This dashboard includes two more visualizations at the bottom showing you both the temperature and motion count throughout your house over time.
Continuing on, you will see dashboards built for each type of event and device. One example is the dashboard for motion, which includes the total motion count around your house, the latest motion status for each motion sensor, a line chart of motion over time for each sensor, and below a list of the raw events. Other dashboards within the app include: presence, switches, switch levels, temperature, humidity, alarms, locks, contact sensors, battery levels, device levels, C0 detectors, smoke detectors, acceleration sensors, energy meters, music players, power meters, illuminance sensors, buttons, and voltages.
The app also supports multiple SmartThings hubs. On each dashboard there is a filter where you can select a particular hub or see all events from every hub. Each dashboard also has another filter to easily select the timeframe you want to look over; ‘today’ is default.
There Are Many Ways to Take Advantage of Splunk—Let’s Share Ideas.
If you are a data junkie like I am and you’re interested in smart devices, using Splunk allows you to comprehensively monitor the events going on in your home in real-time, while giving you a timeline of events if there is ever a need to look back. There are lots of other unique ways to use Splunk, too. Have you read our blog on Splunking Your Car? Check it out!
Have other questions about Splunk? Talk to a Splunk engineer to get more details, or call us at (301)-838-9470.
 Want to learn how to Splunk Your Car?
Learn from our engineer, Alex Maier, about how he Splunked the
data from his car and how you can, too!