How to Optimize Your Use of Splunk Got Splunk? Make Sure You’re Optimizing Your Use of It.
About the Splunk Add-On for Google Cloud Platform
Why Current Splunk Users Using GCP Should Check out the Add-On
What is the Splunk Add-On for Google Cloud Platform?
Have you heard of Splunk’s Add-On for Google Cloud Platform?
While Google Cloud Platform includes tools that offer similar functionalities to Splunk, Splunk is quite unique in the specificity of its features, particularly as a security tool. It’s easy to see why someone might want to feed the data from GCP into Splunk and use Splunk as the tool for collecting, correlating and understanding this information. Simply put, there’s just no Splunk equivalent. There are other tools on GCP that provide access to log data, but there’s no tool that does actual log aggregation, analysis, reporting and alerting, which what makes the add-on valuable.
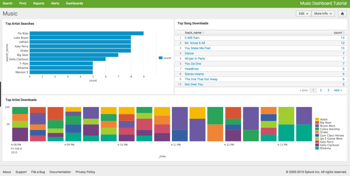
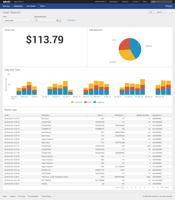
The Splunk app for GCP essentially provides a collection point; a dashboard with useful information and alerts so that you can visualize this data within Splunk based on log data collected from GCP and the apps you’ve built. This add-on simplifies the task of connecting Splunk and GCP together. It indexes events from GCP apps and allows you to perform analysis on the data. The Splunk Add-On for GCP also offers a bunch of pre-built panels you can take advantage of.
Who Should Check out this Add-On?
Most likely an existing Splunk customer who’s either moving workloads to GCP or has workloads in GCP that they want to monitor. If you fit either of those categories, it’s definitely worth checking out. This probably goes without saying, but it’s unlikely you’d be in GCP and spontaneously decide to buy Splunk – although it is possible.
Also worth noting: GCP also offers service monitoring, which is the closest thing to what Splunk does. Including performance metrics, log data around Google Cloud Platform APIs, and it also connects into GCP’s billing data.
Optimizing an App? Explore the Add-On.
This particular add-on could help you with optimizing an app. Also check out GCP’s debugging platform, called Stackdriver. Stackdriver is designed for monitoring, debugging, tracing, logging, error reporting, etc. for specific GCP apps you’ve deployed. It also has a built-in app profiler. If you’re already a Splunk customer and you’re using GCP or plan to, the add-on is an option for to getting other value out of Splunk as well as learning more about how your GCP applications are operating.
Need some pointers on how to get more out of Splunk? Interested in the Splunk Add-on for GCP? August Schell is here to help you learn more. If you’re in search of guidance on maximizing your Splunk investment, get in touch with us today, or call us at (301)-838-9470.
 Are you having an issue on-boarding data with Splunk?
Does your Splunk seem to underperform? Are you having trouble scaling?
We're here to help.


